USE CASES
This page describes some use cases of the G2SG web application.
Analysis of Alexander Disease Gene Sets
BACKGROUND
Alexander disease (AxD) is a rare neurodegenerative disease caused by a mutation in the GFAP gene that codes for the glial fibrillary acidic protein (GFAP)[1]. GFAP protein supports the brain's white matter (the myelin sheath) at normal levels but in Alexander disease, the gain-of-function mutation of the GFAP gene causes this protein to accumulate. Instead of helping maintain myelin, the extra GFAP kills other cells and damages the myelin. The overexpression of GFAP also results in the appearance and accumulation of Rosenthal fibers (RFs), protein aggregates in the cytoplasm of astrocytes [2], in subpial and white matter central nervous system areas which have typically high GFAP expression. Other than RF fiber build-up, astrocytes in Alexander disease also have abnormal cell shape and functionality. Therefore, Alexander disease is marked by this astrocyte phenotype which has physiological manifestations such as seizures. .
The Gene Expression Omnibus (GEO) is a major open biomedical research repository for transcriptomics and other omics datasets that currently contains millions of gene expression samples from tens of thousands of studies collected by research laboratories [3]. Here, we use the G2SG pipeline to analyze gene sets created by comparing gene expression samples obtained from GEO of wild type (WT) or controls to alexander disease samples.
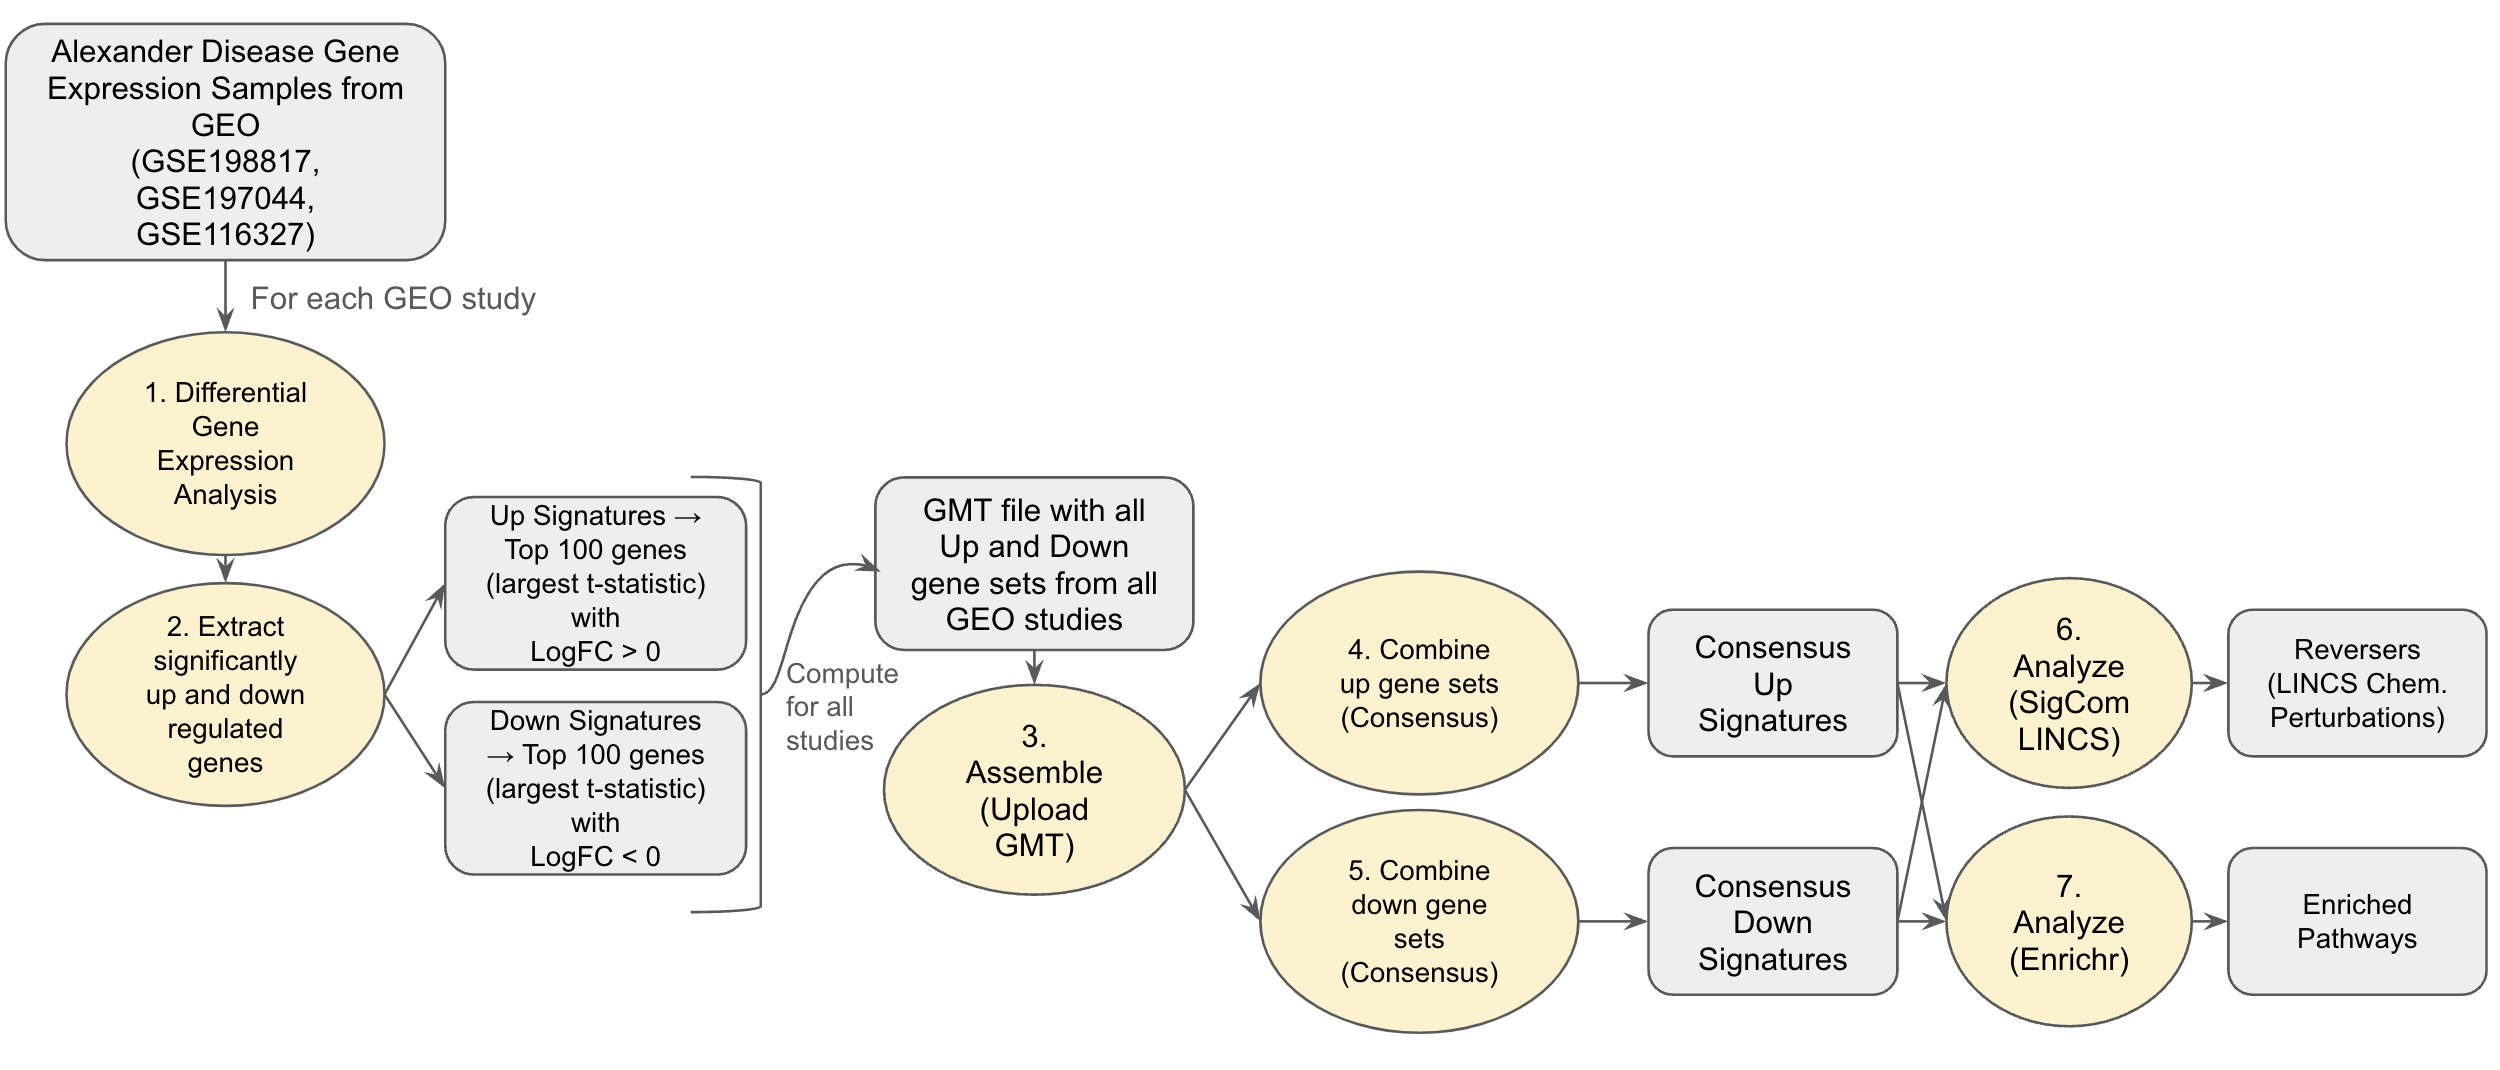
Fig 1: Alexander Disease Use Case Workflow
METHODS
To obtain disease signatures, we perform differential gene expression analysis on RNA-seq gene expression samples from three GEO studies that compare control or wild type to Alexander disease samples (GSE198817 , GSE197044, GSE116327) [4]. The GSE198817 study contains gene expression samples from hippocampus and corpus callosum tissue of Gfap+/+, Gfap+/R236H, and mGFAPTg170-2 transgenic mice. The GSE197044 study contains RNA-seq profiles from hippocampus and corpus callosum tissue of male Gfap+/R236H and Gfap+/+ mice in FVB/N-Tac at 8 weeks of age. The GSE116327 study contains gene expression profiles of healthy control and AxD patient iPSC-derived astrocytes and post-mortem brain tissues. Differentially expressed genes between WT vs. disease samples for each study are computed using the limma method. This analysis was done using the Bulk RNA-seq analysis pipeline appyter [5].
We group these differentially expressed genes into up and down genes with up genes having a logFC > 0 and down genes having logFC < 0. The top 100 differentially expressed up and down genes based on t-statistic scores were then used to create the up and down gene sets for each study. These up and down genes from each sample were then used to create a single .gmt file called the alexander_disease.gmt. The .gmt file was uploaded into the G2SG application for further integrative analysis using the “Upload GMT” option in the Assemble step of the platform. Using the G2SG pipeline, we found consensus up and down signatures which are genes that appear in the majority of all up or down gene sets. We analyze potential drugs that could reverse the gene expression changes by sending the consensus gene sets to SigCom LINCS [6]. We also perform gene set enrichment analysis on the consensus signatures by sending them to Enrichr [1].
Taking the consensus of all up gene sets (with a consensus cut-off of 6) yields seven genes that appear in at least 6 of the 10 up gene sets. We can analyze potential drugs that could reverse the gene expression changes by sending the consensus gene set to SigCom LINCS [6].
RESULTS AND DISCUSSION
Choosing the consensus criteria of 3, our consensus up signature contains 65 genes while our consensus down signature contains 20 genes. The enrichment results are presented as bar charts along with links to the reports in Enrichr. The upregulated genes (consensus up signature) are enriched for brain related terms such as complement system in neuronal development and plasticity, spinal cord injury and TYROBP causal network in microglia. The downregulated genes are also enriched for neurobiological terms such as phosphodiesterases in neuronal function and neuroinflammation and glutamatergic signaling.
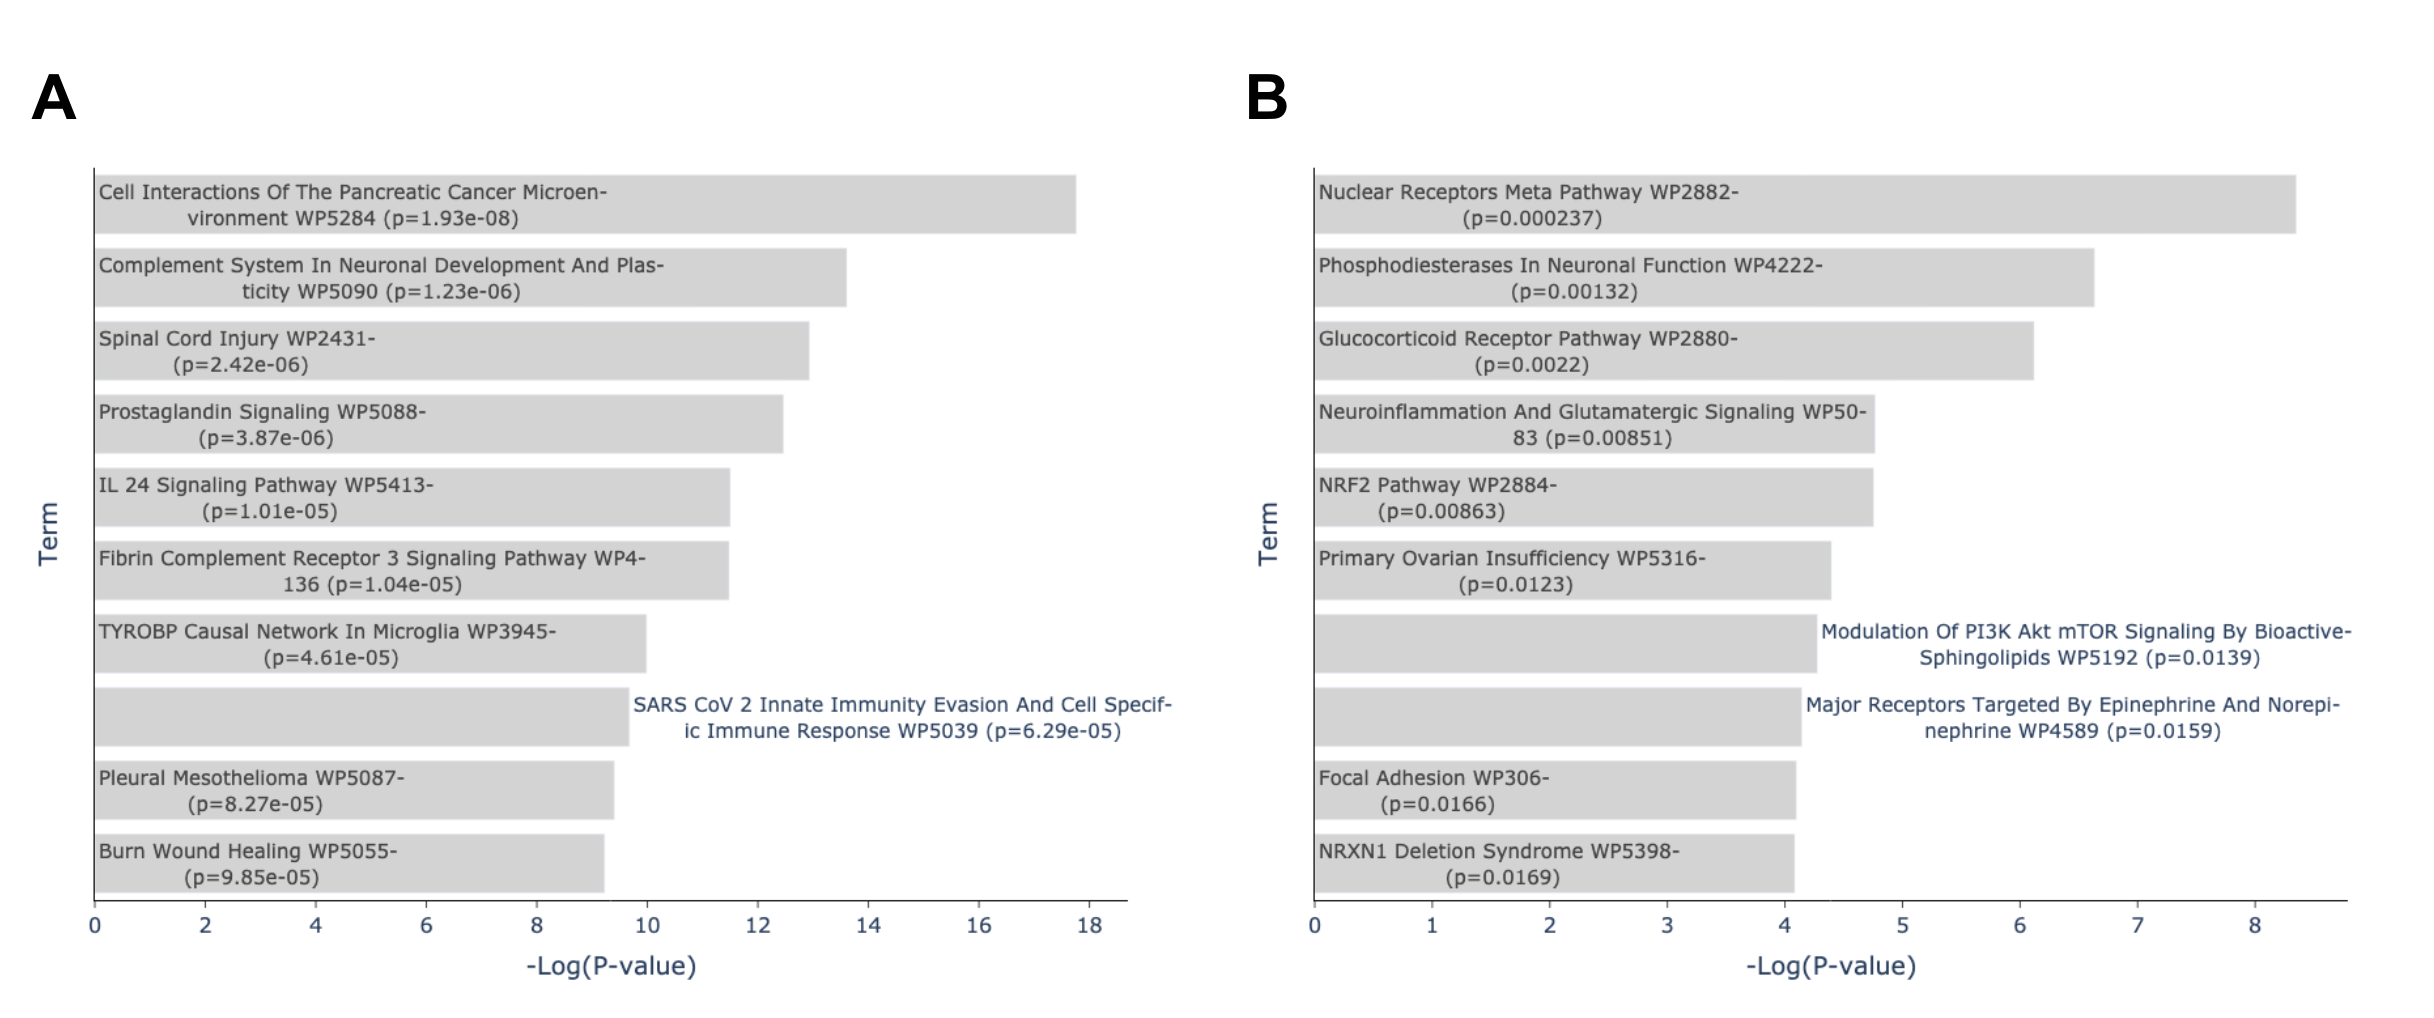
Fig 2: Enrichment analysis of consensus up and down signature gene sets in Enrichr. (A) Top enriched terms from WikiPathway 2023 Human library of consensus up signature gene set in Enrichr. Consensus signature is consensus n=3 of up signatures. Plot from: https://maayanlab.cloud/Enrichr/enrich?dataset=c24d601f51ffb6f071642514d1b3a02f (B) Top enriched terms from WikiPathway 2023 Human library of consensus down signature gene set in Enrichr. Consensus signature is consensus n=3 of down signature gene sets. Plot from: https://maayanlab.cloud/Enrichr/enrich?dataset=425ca9fd10bf9f97577a8b8620681d79
Using the SigCOM LINCS API, we queried the consensus (n=3) up and down gene sets against all the LINCS L1000 chemical perturbation signatures to find drugs that reverse the consensus disease signature. This returns drug signatures with the z-sum and rank of each signature. Reversers (signatures that have up-regulated genes more similar to the input down genes, and the down-regulated genes more similar to the input up genes) have negative z-sums and mimickers (signatures that have similar up-regulated genes to the input up gene list, and down-regulated genes to the down gene list) have positive z-sums. Therefore, with the ranking of signatures done with the most positive z-sums being higher and most negative z-sums being lower, reversers are ranked towards the end. For each drug, we compute the Kolmogorov–Smirnov statistic using Scipy python library by (i) comparing the observed z-sum scores of its signatures to a normal distribution and (ii) comparing the observed ranks to the uniform distribution. These are used to rank the drugs based on a KS-score to find the drugs with the highest concentration of signatures at the bottom of the ranked list. There are 7 drugs that appear in both the top 10 ranked drugs from both methods: bortezomib, MG-132, vorinostat, panobinostat, GSK-1059615, BI-2536 and brefeldin-a.
Vorinostat, a member of a class of drugs known as histone deacetylase (HDAC) inhibitors, is an FDA-approved drug for cutaneous T-cell lymphoma (CTCL). The drug has been found to decrease GFAP expression in glioblastoma cells [7]. Other studies have shown that the inhibition of histone deacetylases (HDACs) with trichostatin A or sodium butyrate reduced GFAP expression in primary human astrocytes and astrocytoma cells [8]. Another highly ranked reverser found was panobinostat, also an FDA-approved histone deacetylase (HDAC) inhibitor which is used to treat multiple myeloma in combination with bortezomib and dexamethasone [9]. With a main mechanism of action similar to vorinostat of inhibiting HDAC, panobinostat may also be a potential drug to treat Alexander disease. Another potential therapeutic agent is BI-2536. BI-2536 is a polo-like kinase 1 (PLK1) inhibitor and studies show that PLK1 inhibition induces cell autophagy and that it results in mTOR dephosphorylation [10]. Therefore, BI-2536 may potentially serve as a therapeutic agent for treating Alexander's disease because autophagic clearance of accumulated GFAP protein is regulated by the p38/MAPK and mTOR signaling pathways [11], which the drug has been found to inhibit.
CONCLUSION
Here, we use the G2SG Assemble-Augment-Combine-Visualize-Analyze pipeline to explore possible targets and drugs that can reverse the gene expression changes related to Alexander Disease. We show that G2SG is a powerful tool that helps analyze gene sets created from related experiments and studies such as those created from the differential gene expression analyses of gene expression samples from Alexander disease studies. This enables users to find potential biomarkers and therapeutic treatments for the disease which are not limited to only one study.
REFERENCES
-
[1] J. Kuhn and M. Cascella, Alexander Disease. StatPearls Publishing, 2023.
-
[2] A. Messing, M. W. Head, K. Galles, E. J. Galbreath, J. E. Goldman, and M. Brenner, “Fatal encephalopathy with astrocyte inclusions in GFAP transgenic mice,” Am. J. Pathol., vol. 152, no. 2, pp. 391–398, Feb. 1998.
-
[3] T. Barrett et al., “NCBI GEO: archive for functional genomics data sets--update,” Nucleic Acids Res., vol. 41, no. Database issue, pp. D991–5, Jan. 2013.
-
[4] S. C. Gammie, A. Messing, M. A. Hill, C. A. Kelm-Nelson, and T. L. Hagemann, “Large-scale gene expression changes in APP/PSEN1 and GFAP mutation models exhibit high congruence with Alzheimer’s disease,” PLoS One, vol. 19, no. 1, p. e0291995, Jan. 2024.
-
[5] D. J. B. Clarke et al., “Appyters: Turning Jupyter Notebooks into data-driven web apps,” Patterns (N Y), vol. 2, no. 3, p. 100213, Mar. 2021.
-
[6] J. E. Evangelista et al., “SigCom LINCS: data and metadata search engine for a million gene expression signatures,” Nucleic Acids Res., vol. 50, no. W1, pp. W697–W709, Jul. 2022.
-
[7] T. Perez, R. Berges, H. Maccario, D. Braguer, and S. Honoré, “P11.06 Non epigenetic effect of vorinostat in glioblastoma cells,” Neuro. Oncol., vol. 21, no. Suppl 3, p. iii43, Sep. 2019.
-
[9] R. Kanski et al., “Histone acetylation in astrocytes suppresses GFAP and stimulates a reorganization of the intermediate filament network,” J. Cell Sci., vol. 127, no. Pt 20, pp. 4368–4380, Oct. 2014.
-
[9] K. Wahaib, A. E. Beggs, H. Campbell, L. Kodali, and P. D. Ford, “Panobinostat: A histone deacetylase inhibitor for the treatment of relapsed or refractory multiple myeloma,” Am. J. Health. Syst. Pharm., vol. 73, no. 7, pp. 441–450, Apr. 2016.
-
[10] Y.-F. Tao et al., “Inhibiting PLK1 induces autophagy of acute myeloid leukemia cells via mammalian target of rapamycin pathway dephosphorylation,” Oncol. Rep., vol. 37, no. 3, pp. 1419–1429, Mar. 2017.
-
[11] G. Tang et al., “Autophagy induced by Alexander disease-mutant GFAP accumulation is regulated by p38/MAPK and mTOR signaling pathways,” Hum. Mol. Genet., vol. 17, no. 11, pp. 1540–1555, Jun. 2008.
CFDE GMT Crossing: GTEx Aging Signatures vs MoTrPAC Exercise Gene Sets
BACKGROUND
Aging is the most profound risk factor for many chronic and non-infectious diseases such as diabetes [1], cardiovascular disease [2] and neurological diseases such as Alzheimer's [3] and Parkinson’s disease [4]. This risk has been linked to the overlap between the molecular basis of these diseases and that of aging [5], [6]. Moderate exercise (planned and intentional physical activity [7]) has become widely accepted as to promote health and aid the prevention of diseases [8] with exercise being shown to induce organelle, cellular, blood-brain and external barrier protection [36], [37], protein proteostasis [9], DNA repair [10], anti-inflammation (as C-reactive protein concentration is strongly related to physical activity [11]), autophagy regulation [12], and other processes which positively contribute to better health and many of which counter the molecular mechanisms of aging [13]. Aging signatures are changes in gene expression which accompany the biological process of aging. The goal of the Molecular Transducers of Physical Activity Consortium (MoTrPAC) is to assess molecular changes that occur in response to physical activity [14]. To investigate the common biological underpinnings that accompany both aging and exercise and discover genes that are induced and repressed due to exercise and also change in levels due to aging, we crossed the aging signatures created from GTEx [15] with the MoTrPAC rat endurance training [16] gene sets.
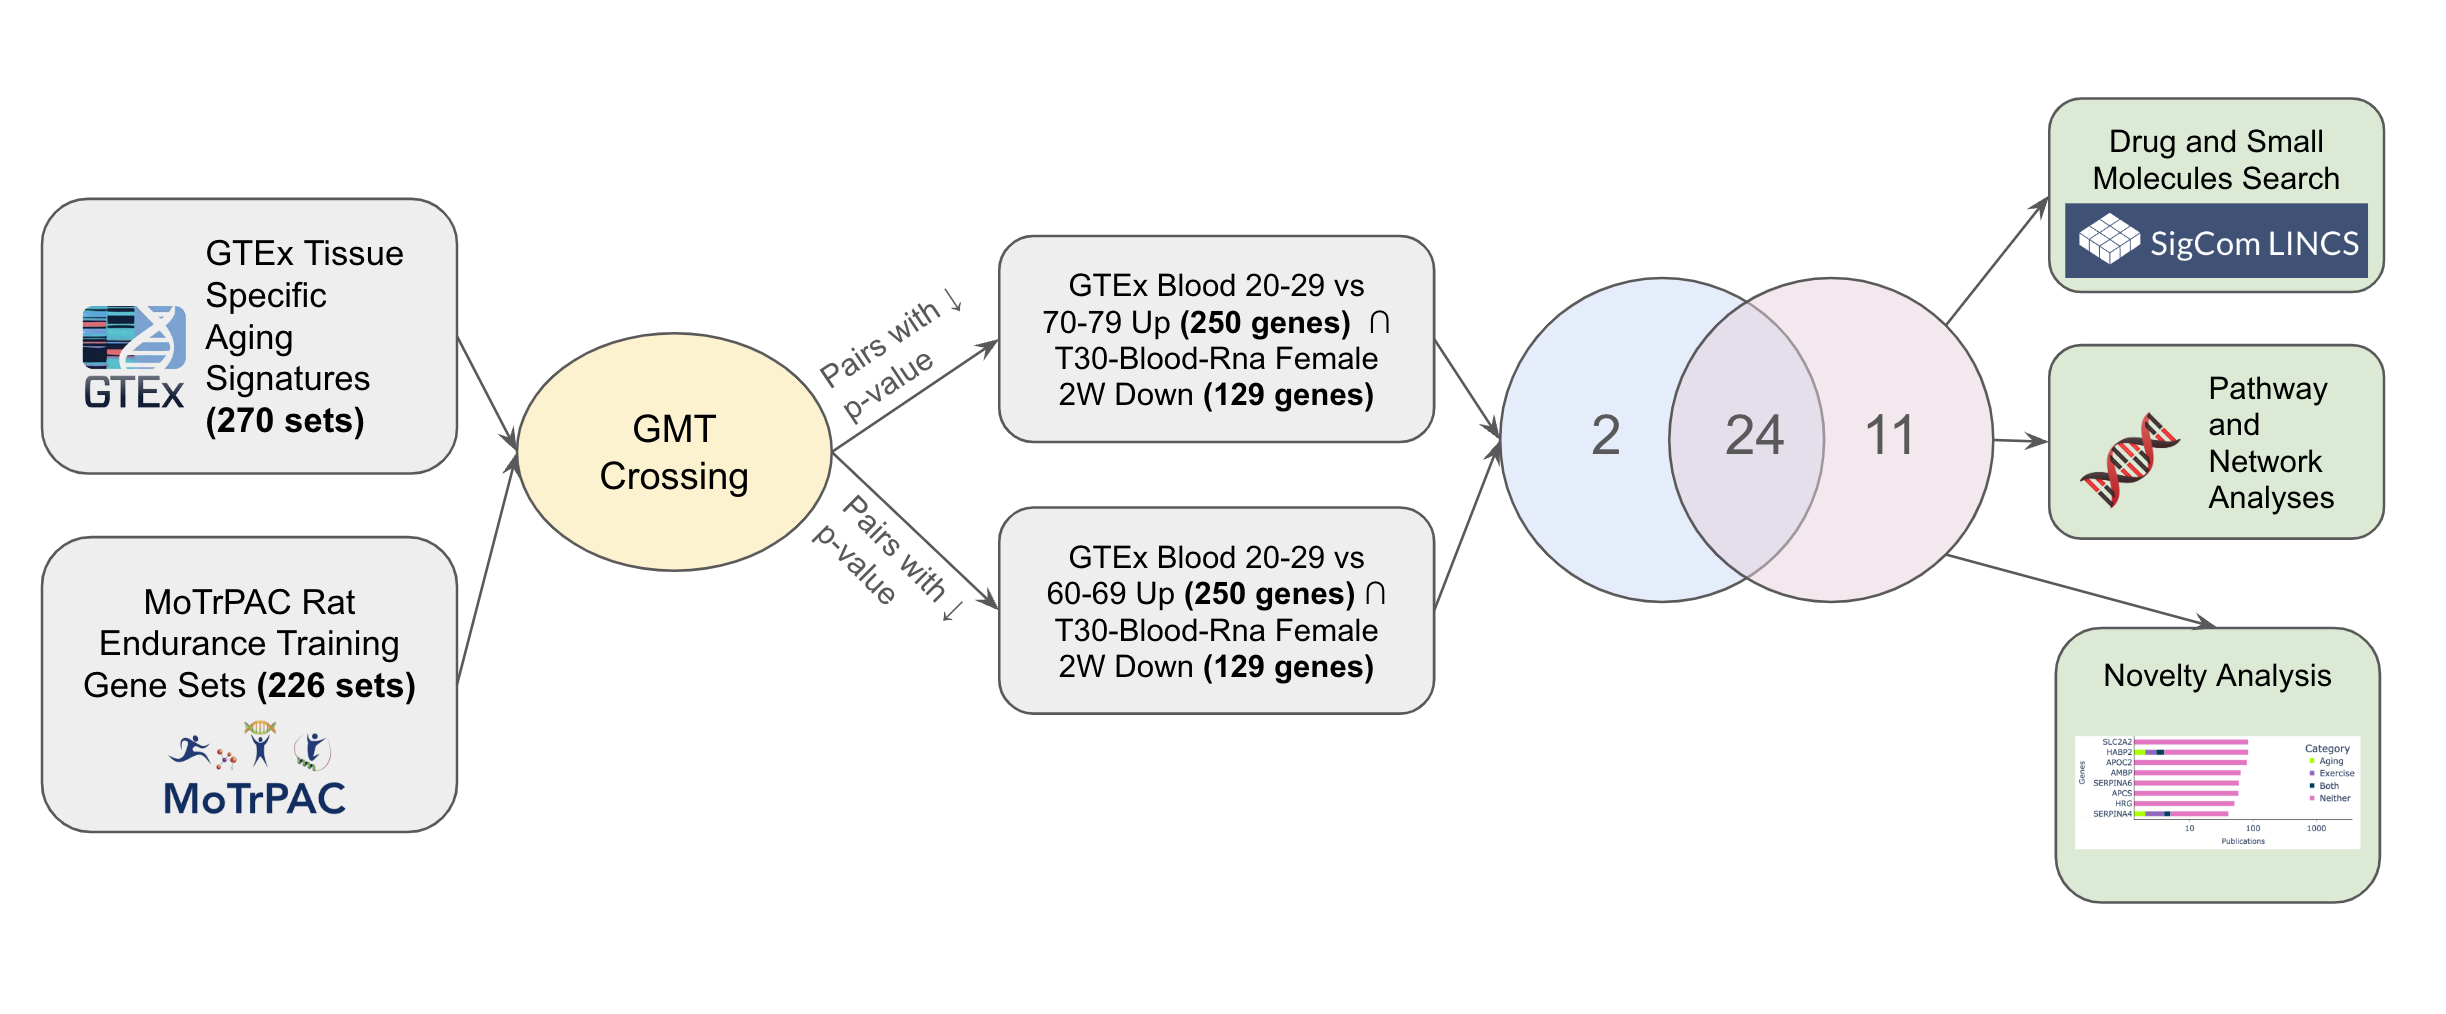
Fig. 1: Exploring shared pathways implicated in aging and exercise use case workflow.
METHOD
GTEx data provides 1000 samples of gene expression data across 43 tissues from 175 individuals in order to examine how genetic expression varies among tissues [17]. To create GTEx aging signatures, for each tissue, we performed a differential expression analysis using limma voom that compares the expression levels of the young population (ages 20-29) with sex matched older populations e.g patients aged 20-29 vs 60-69. Each generated gene set in the gene set library consisted of up/down differentially expressed genes for each tissue and younger-older comparison group.
To create the MoTrPAC rat endurance gene sets, we performed a differential expression analysis which compared the gene expression levels of a training group vs sex-matched controls for each tissue at every time point (exercise duration) in the study. This data comes from the RNA-seq data created by the MoTrPAC Data Coordination Center (DCC) that measured the gene expression levels or rats across a range of ages and fitness levels by molecular probing of multiple tissues before and after acute and chronic exercise. The resulting dataframe was filtered for genes that have an adjusted p-value < 0.05 to get the gene expression signatures for specific tissue, sex, and time point group . We obtained the up and down differentially expressed genes for each specific tissue, sex, and time point group with up genes being genes with a log fold change (logFC) > 0 and down genes being genes with a log fold change (logFC) < 0. Each gene set in the generated gene set library consisted of up/down differentially expressed genes for each specific tissue, sex, and time point group.
The CFDE GMT crossing feature allows users to cross the GMT files generated by Common Fund DCCs in order to find gene set pairs from the different GMTs that have a significant overlap. The Fisher's exact test is used to quantify the significance of such overlap. We crossed all pairs of gene sets across all libraries and retained gene sets pairs with a p-value < 0.001. The top 5000 pairs of sets of each crossing are saved and displayed in an interactive table. The overlapping genes between each pair can be sent to Enrichr [18] for enrichment analysis or to a GPT-4 model [19] for hypothesis generation about the potential reason for overlap between the gene sets that make up the crossed gene set pair. To create the GPT-4 generated hypothesis, we give GPT-4 a textual description of each gene set in the crossed pair, the overlapping genes, the enriched terms from Enrichr using the GO Biological Processes [20], WikiPathway 2023 Human [21], MGI Mammalian Phenotype Level 4 [22], and GWAS Catalog 2023 [23] libraries as backgrounds, and then ask it to compose an abstract that describes the potential connection between these gene sets.
RESULT AND DISCUSSION
Crossing the GTEx Aging Signatures and MoTrPAC Rat Endurance Training GMTs yields 346 gene set pairs with significant overlap (p-value < 0.001). The top two crossing gene set pairs (GTEx Blood 20-29 vs 60-69 Up ∩ T30-Blood-Rna Female 2W Down and GTEx Blood 20-29 vs 70-79 Up ∩ T30-Blood-Rna Female 2W Down) have 35 (p-value=6.52e-38) and 26 (p-value=1.05e-24) overlapping genes respectively. Furthermore, by adding these overlapping genes to our cart and using them to start an interactive session, the intersection set operation of the top two pairs shows these sets share 24 genes in common
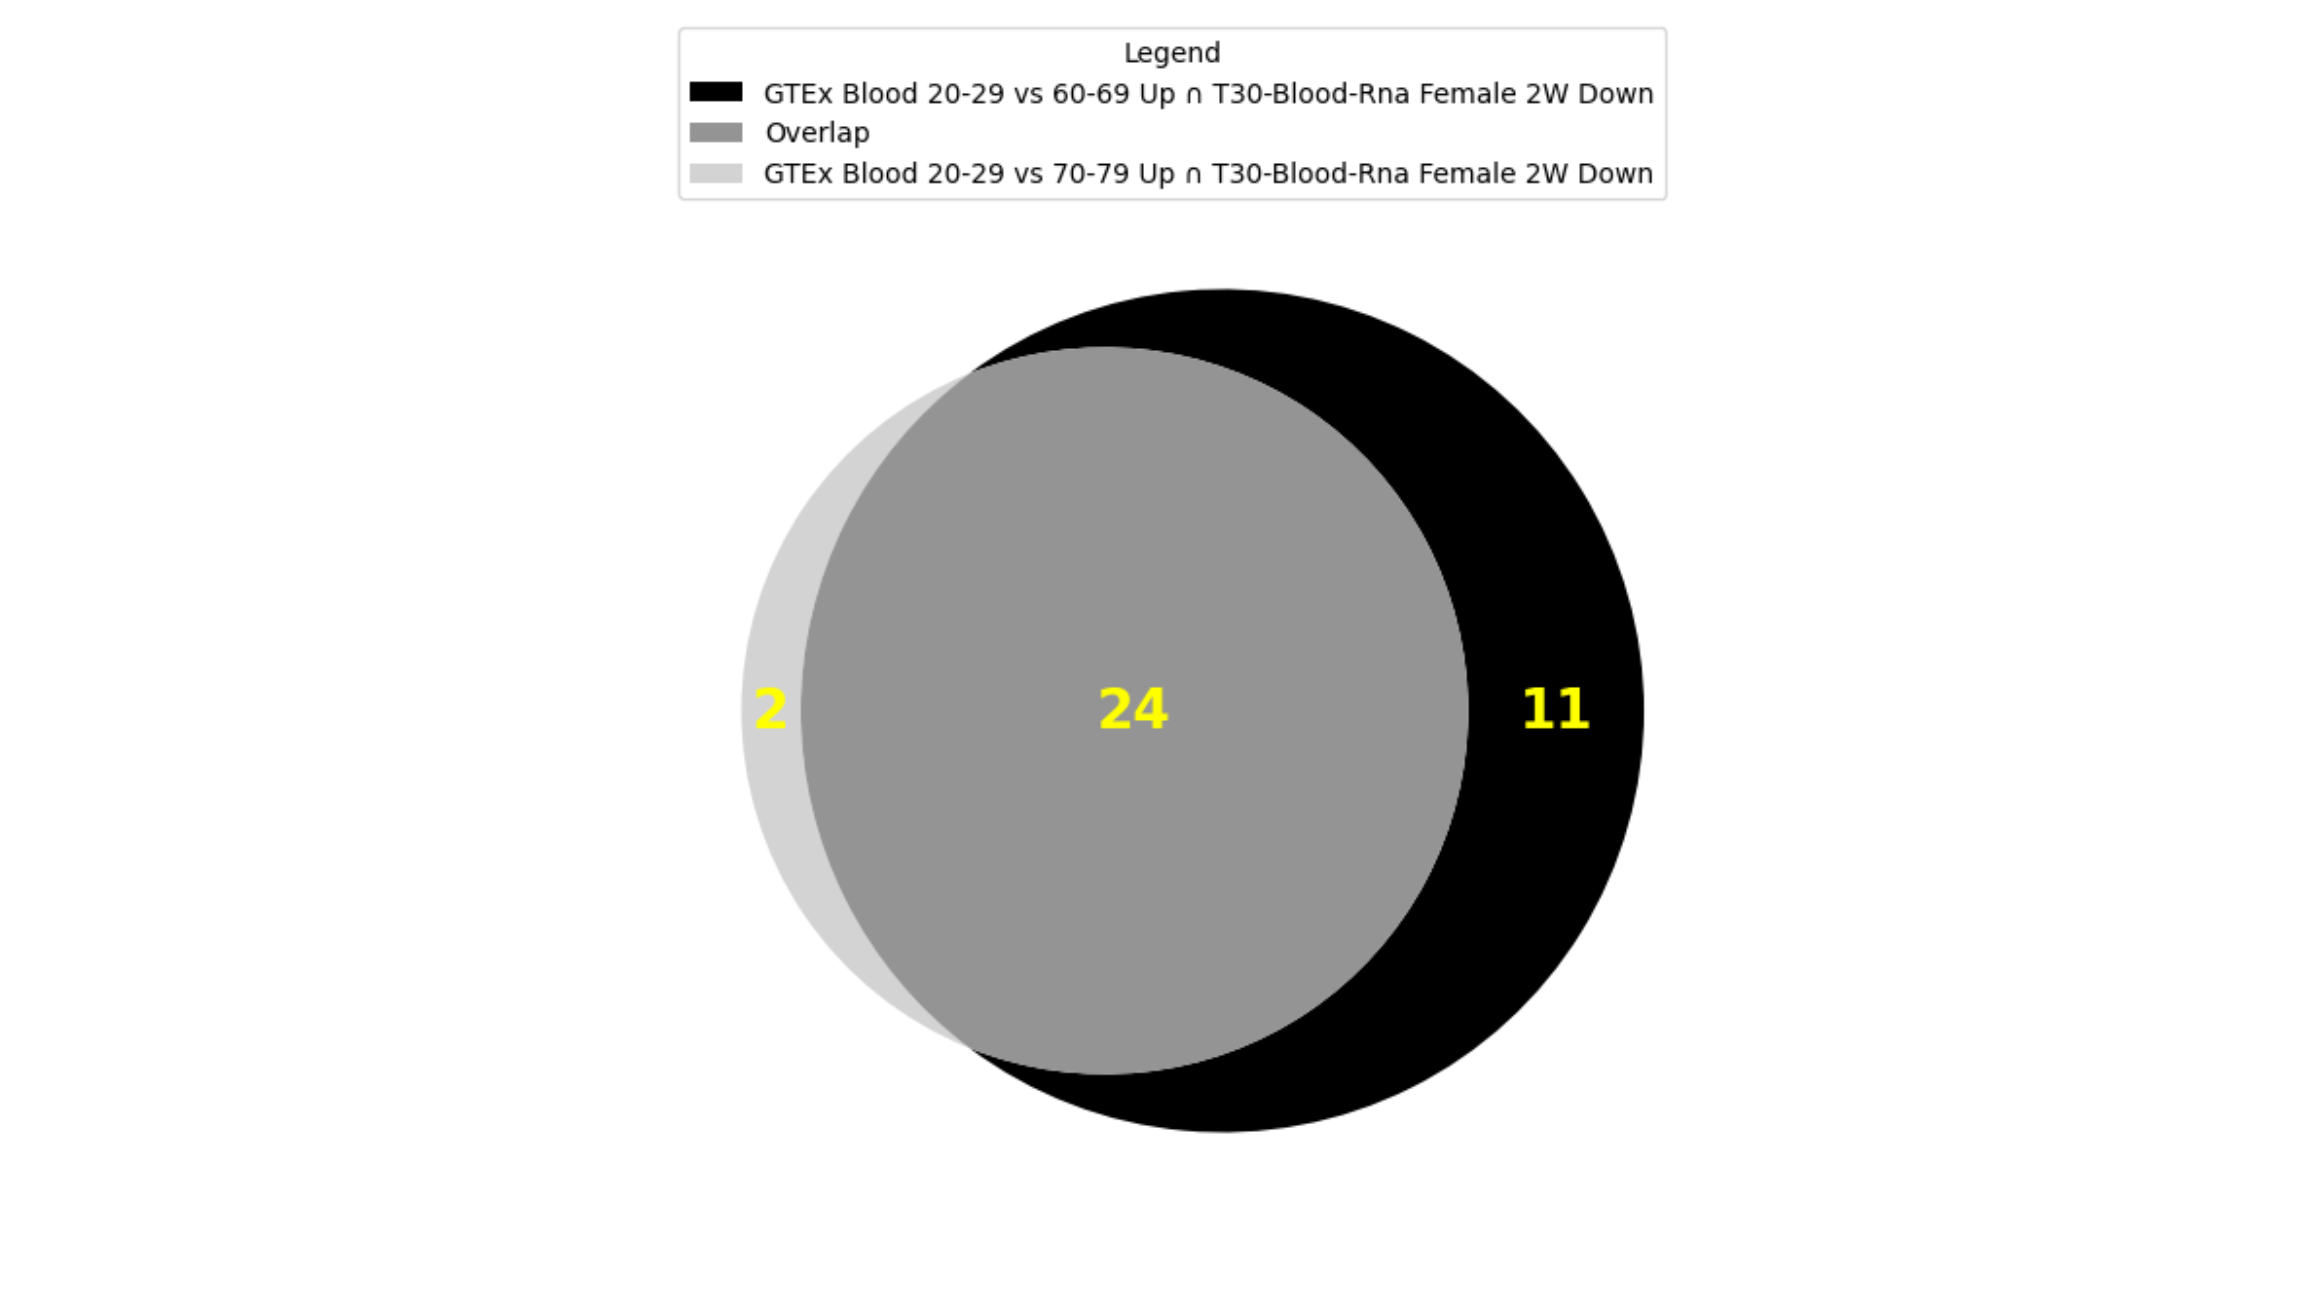
Fig. 2: Overlap between top 2 crossing results of GTEx Aging Signatures vs MoTrPAC Rat Endurance Training libraries.
The GTEx Blood 20-29 vs 60-69 Up gene set contains genes that are upregulated when comparing the blood of subjects aged 60-60 to those aged 20-29. GTEx Blood 20-29 vs 70-79 Up gene set contains genes that are upregulated when comparing the blood of subjects aged 60-60 to those aged 20-29. The T30-Blood-Rna Female 2W Down gene set consists of genes that are downregulated in the blood of rats after four weeks of endurance training. The enrichment analysis found enriched pathways related to immune response, blood coagulation, and lipid metabolism, which are all processes that are well accepted to be affected by aging and physical activity (Fig. 9). Some enriched terms are blood related processes that are particularly known to undergo significant changes with aging and exercise such as blood coagulation and fibrinolysis. It is well known that aging is associated with increased plasma levels of many proteins of blood coagulation [24]. Additionally, short term exercise is also associated with transient increase in blood coagulation, moderate exercise with enhancing blood fibrinolytic activity without activation of blood coagulation mechanisms while heavy exercise induces simultaneous activation of blood fibrinolysis and coagulation [25]. Research also shows that blood lipids are a likely source of human aging biomarkers with blood lipid levels (including total cholesterol, low- and high-density lipoprotein cholesterol, and triglyceride concentrations) changing in specific ways with age [26], [27] while endurance exercise induces fat oxidation [28].
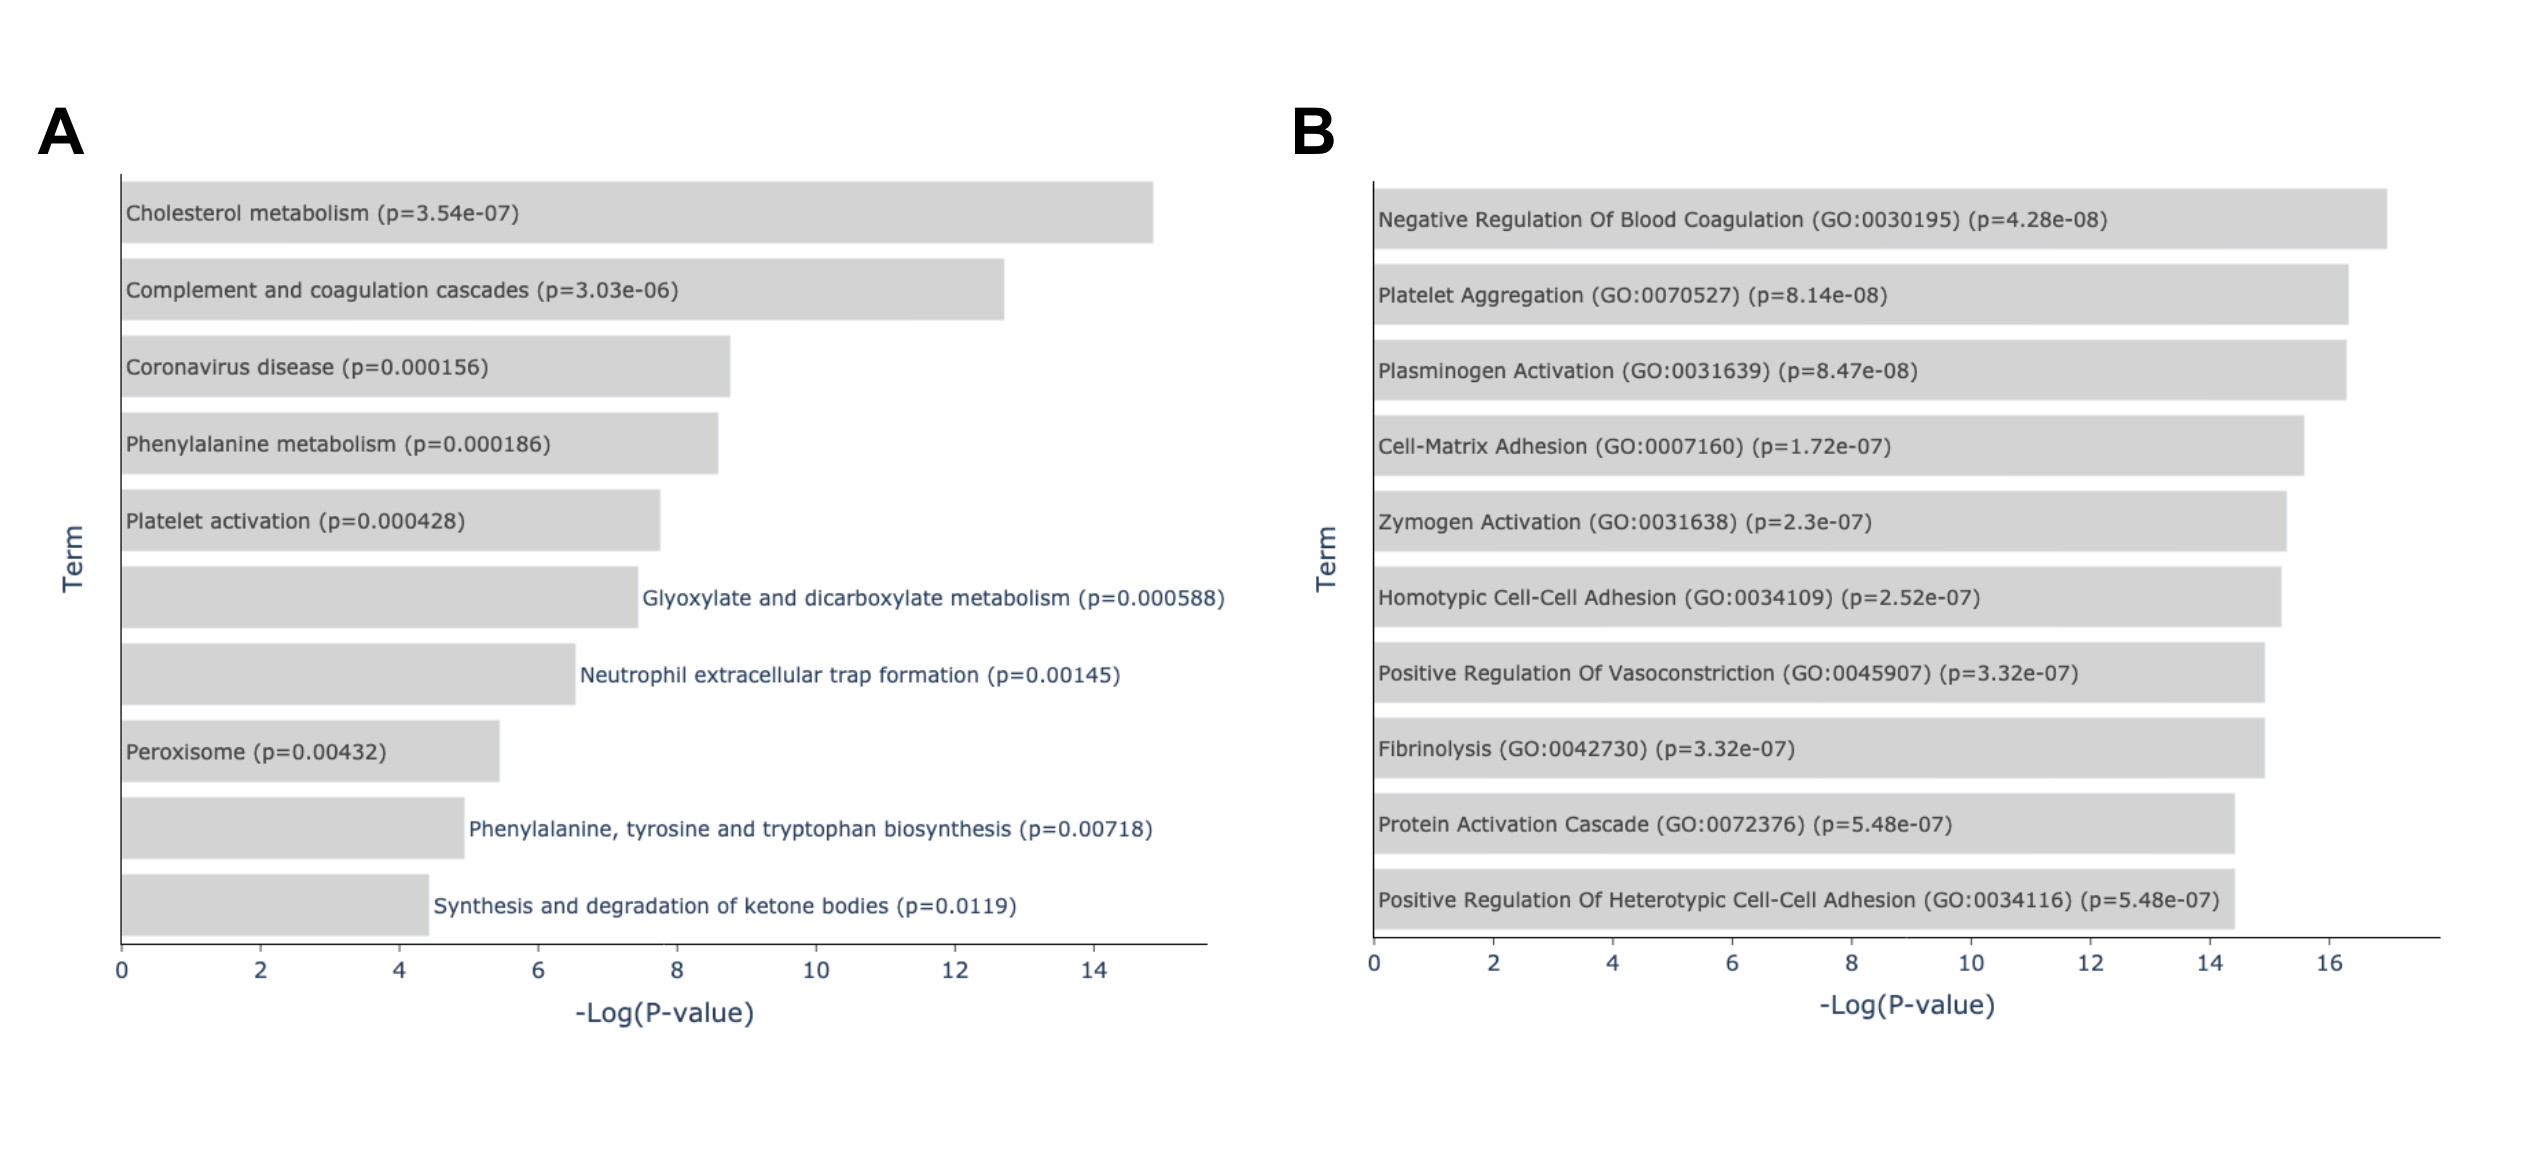
Fig. 3: Enrichment analysis of top overlapping genes of the top 2 crossing results of GTEx Aging Signatures vs MoTrPAC Rat Endurance Training libraries. (A) Enriched terms from the KEGG 2021 Human library based on the overlapping genes between A: GTEx Blood 20-29 vs 70-79 Up ∩ T30-Blood-Rna Female 2W Down and B: GTEx Blood 20-29 vs 60-69 Up ∩ T30-Blood-Rna Female 2W Down gene sets. Link: https://maayanlab.cloud/Enrichr/enrich?dataset=d1a0862c3a236d626ef4567f96f4b526. (B) Enriched terms from the GO Biological Processes library based on the overlapping genes between A: GTEx Blood 20-29 vs 70-79 Up ∩ T30-Blood-Rna Female 2W Down and B: GTEx Blood 20-29 vs 60-69 Up ∩ T30-Blood-Rna Female 2W Down gene sets. Link: https://maayanlab.cloud/Enrichr/enrich?dataset=d1a0862c3a236d626ef4567f96f4b526
The GPT-4 generated hypothesis further explains the possible ways that these overlapping genes are tied to the physiological changes that accompany both aging and exercise through these enriched pathways. It proposes that the high overlap between the two gene sets could be due to the shared influence of aging and physical activity on these biological pathways and processes in opposing ways. The GPT-4 generated hypothesis posits that the overlap is because “Aging is associated with changes in lipid metabolism and increased risk of cardiovascular diseases, while regular physical activity can improve lipid profile and reduce the risk of cardiovascular diseases. Aging can lead to changes in blood coagulation, and physical activity is known to influence blood viscosity and coagulation.”
This is in line with studies which have shown that exercise can reverse many of the hallmarks of aging through anti-aging mechanisms [31] giving it therapeutic potential for aging related diseases.
A novelty assessment of the top crossing pair sets was done by comparing the number of publications each gene is associated with according to GeneRIF (Fig. 10). We find that 65% of the genes contained in those sets are associated in less than 100 publications in PubMed with two genes (HAO1 and SLC25A47) being associated with less than 10 publications. We also find that of these 37 genes, only 11 are found to be related to aging or exercise (CRP, HNF4A, TTR, HAMP, FGB, RBP4, FGA, APOC1, HABP2, SERPINA4 and AGXT2). These results suggest that many of our observed genes are understudied in the context of both aging and exercise, and the relationship between these two processes that our crossing results have shown to be significantly related. This provides evidence for the need for further exploration of the link between these genes and both aging and exercise.
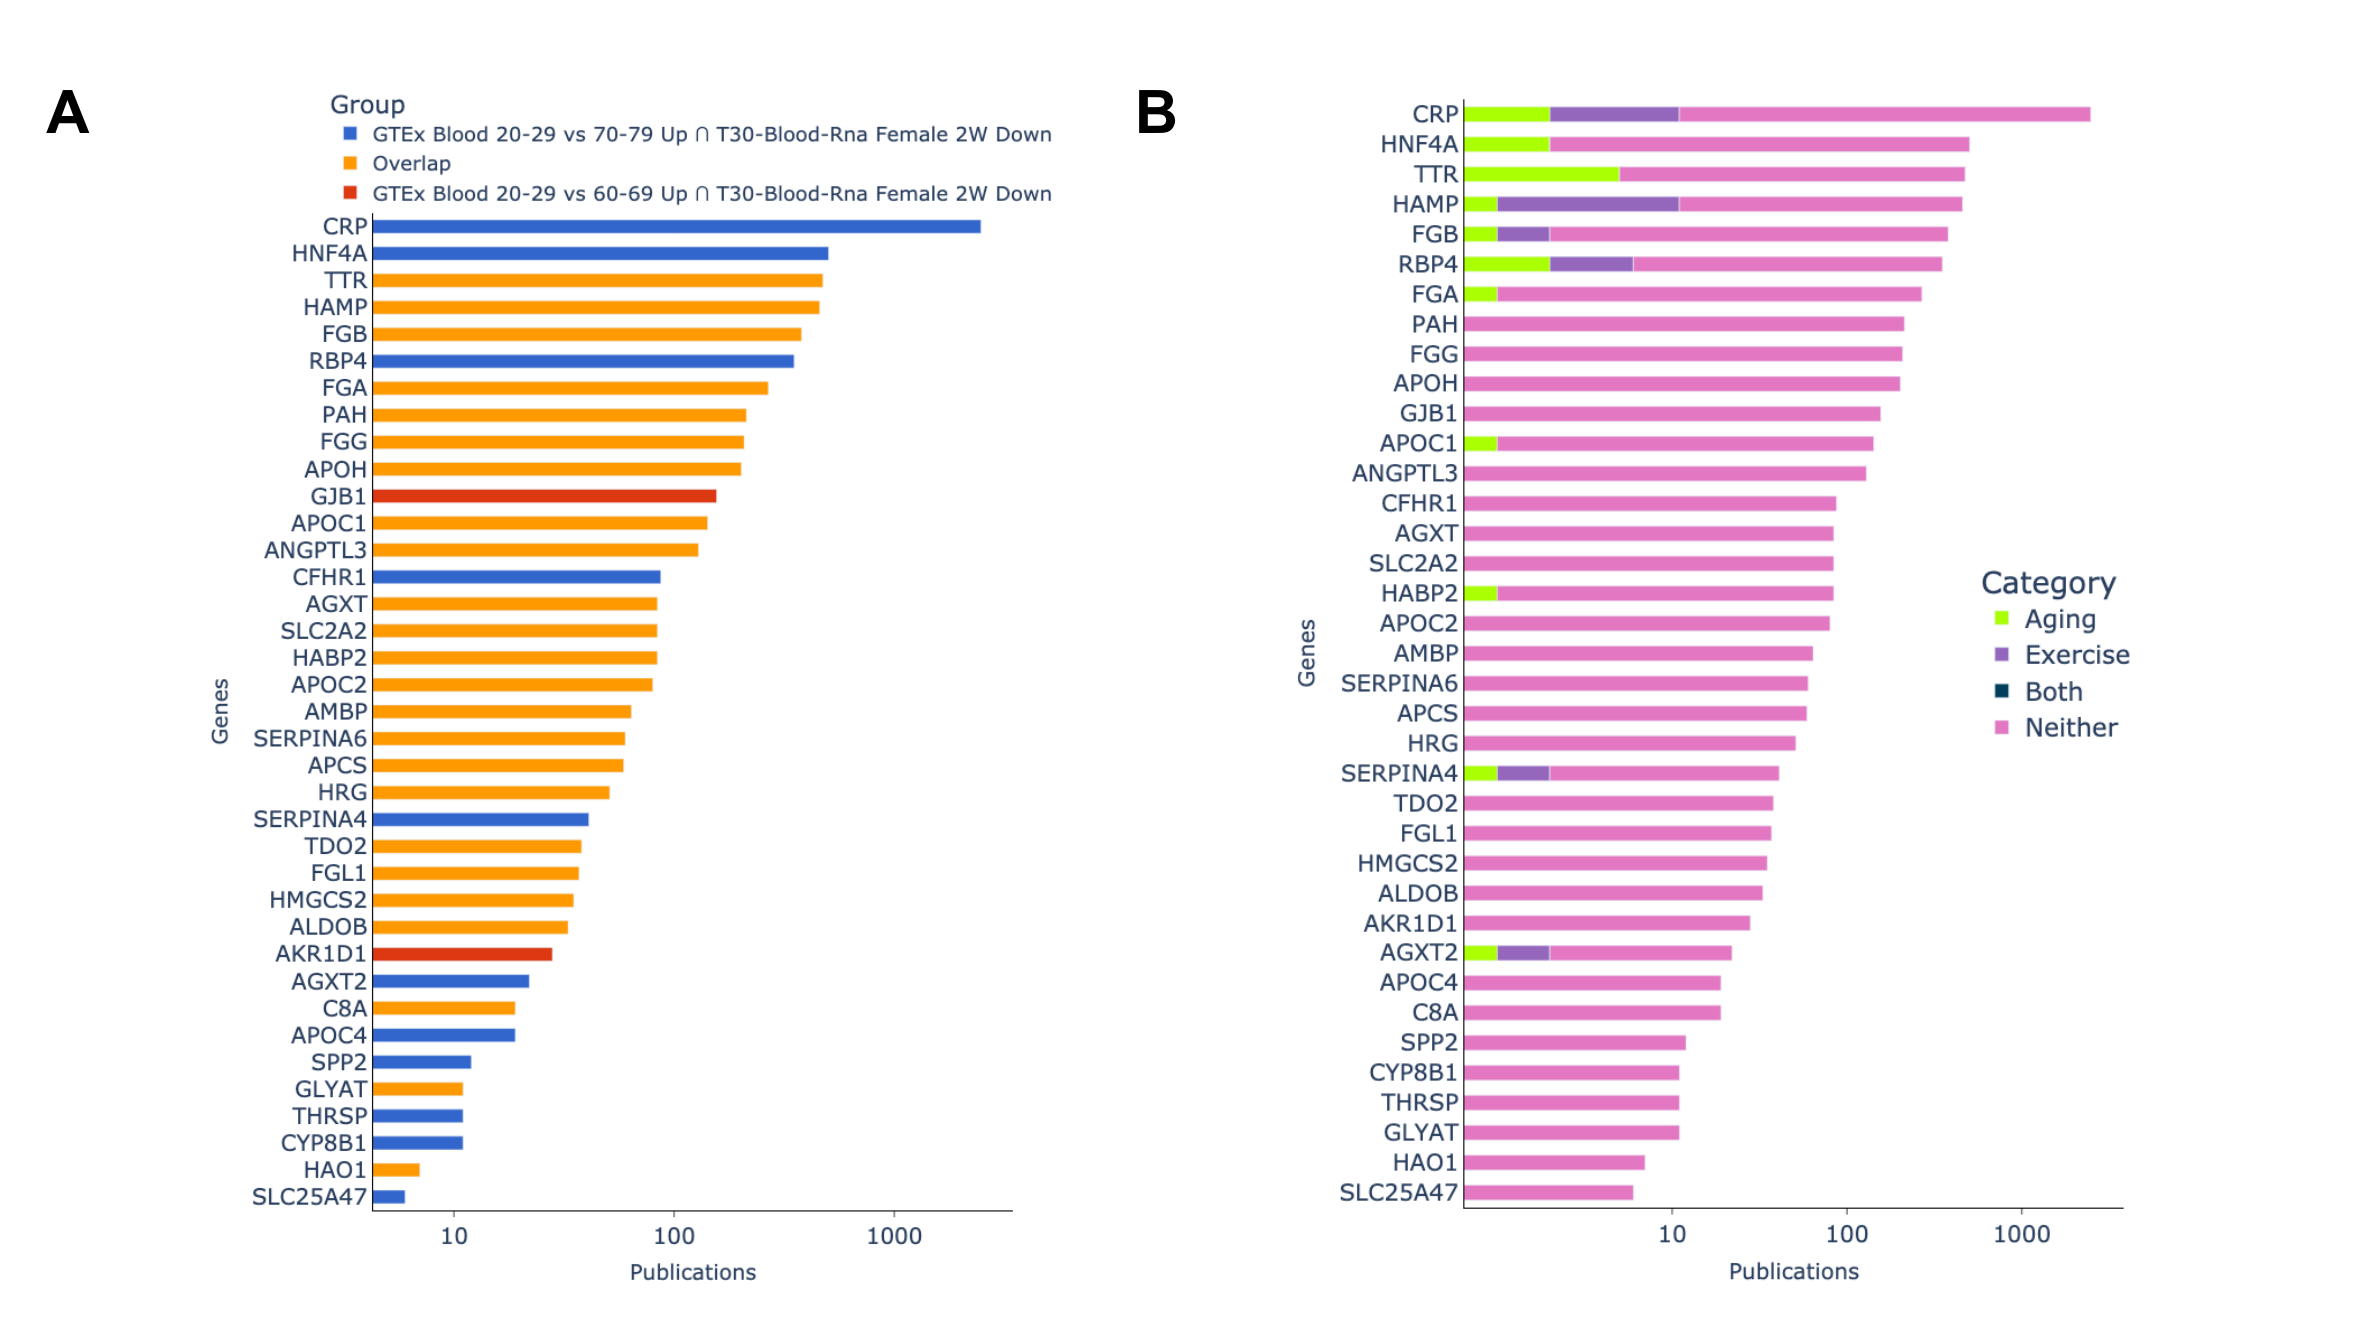
Fig. 4: Novelty assessment of top 2 crossing results. (A): Genes grouped by which gene set they appeared in. (B): Showing if publications genes are associated with are related to aging, exercise,or both terms based on GeneRIF
CONCLUSION
Here, we found some biological pathways and their related genes that are associated with both aging and exercise through crossing aging signatures created from GTEx and exercise related gene sets from MoTrPAC. Many of these genes are mentioned in less than 100 publications which suggests that they might be understudied. This provides evidence for further exploration of the link between these genes and both aging and exercise (Fig.3). This displays the utility of the G2SG application in integrating data sets produced from various Common Fund programs to stimulate scientific discovery.
REFERENCES
-
[1] H. L. C. Wilkerson, “Problems of an Aging Population,” Am. J. Public Health Nations. Health, vol. 37, no. 2, pp. 177–188, Feb. 1947.
-
[2] B. J. North and D. A. Sinclair, “The intersection between aging and cardiovascular disease,” Circ. Res., vol. 110, no. 8, pp. 1097–1108, Apr. 2012.
-
[3] X. Xia, Q. Jiang, J. McDermott, and J.-D. J. Han, “Aging and Alzheimer’s disease: Comparison and associations from molecular to system level,” Aging Cell, vol. 17, no. 5, p. e12802, Oct. 2018.
-
[4] A. Reeve, E. Simcox, and D. Turnbull, “Ageing and Parkinson’s disease: why is advancing age the biggest risk factor?,” Ageing Res. Rev., vol. 14, no. 100, pp. 19–30, Mar. 2014.
-
[5] G. Wick, P. Jansen-Dürr, P. Berger, I. Blasko, and B. Grubeck-Loebenstein, “Diseases of aging,” Vaccine, vol. 18, no. 16, pp. 1567–1583, Feb. 2000.
-
[6] D. Saul and R. L. Kosinsky, “Epigenetics of Aging and Aging-Associated Diseases,” Int. J. Mol. Sci., vol. 22, no. 1, Jan. 2021, doi: 10.3390/ijms22010401.
-
[7] C. J. Caspersen, K. E. Powell, and G. M. Christenson, “Physical activity, exercise, and physical fitness: definitions and distinctions for health-related research,” Public Health Rep., vol. 100, no. 2, pp. 126–131, Mar-Apr 1985.
-
[8] C. Fiuza-Luces et al., “Exercise benefits in cardiovascular disease: beyond attenuation of traditional risk factors,” Nat. Rev. Cardiol., vol. 15, no. 12, pp. 731–743, Dec. 2018.
-
[9] M. A. Małkiewicz, A. Szarmach, A. Sabisz, W. J. Cubała, E. Szurowska, and P. J. Winklewski, “Blood-brain barrier permeability and physical exercise,” J. Neuroinflammation, vol. 16, no. 1, p. 15, Jan. 2019.
-
[10] P. S. Souza et al., “Physical Exercise Attenuates Experimental Autoimmune Encephalomyelitis by Inhibiting Peripheral Immune Response and Blood-Brain Barrier Disruption,” Mol. Neurobiol., vol. 54, no. 6, pp. 4723–4737, Aug. 2017.
-
[11] R. V. Musci, K. L. Hamilton, and B. F. Miller, “Targeting mitochondrial function and proteostasis to mitigate dynapenia,” Eur. J. Appl. Physiol., vol. 118, no. 1, pp. 1–9, Jan. 2018.
-
[12] Z. Radák et al., “Exercise training decreases DNA damage and increases DNA repair and resistance against oxidative stress of proteins in aged rat skeletal muscle,” Pflugers Arch., vol. 445, no. 2, pp. 273–278, Nov. 2002.
-
[13] E. S. Ford, “Does exercise reduce inflammation? Physical activity and C-reactive protein among U.S. adults,” Epidemiology, vol. 13, no. 5, pp. 561–568, Sep. 2002.
-
[14] J. A. Sanford et al., “Molecular Transducers of Physical Activity Consortium (MoTrPAC): Mapping the Dynamic Responses to Exercise,” Cell, vol. 181, no. 7, pp. 1464–1474, Jun. 2020.
-
[15] K. Jia, C. Cui, Y. Gao, Y. Zhou, and Q. Cui, “An analysis of aging-related genes derived from the Genotype-Tissue Expression project (GTEx),” Cell Death Discov, vol. 4, p. 26, Aug. 2018.
-
[16] S. Schenk et al., “Physiological Adaptations to Progressive Endurance Exercise Training in Adult And Aged Rats: Insights from The Molecular Transducers of Physical Activity Consortium (MoTrPAC),” Function, doi: 10.1093/function/zqae014.
-
[17] T. G. Consortium et al., “The Genotype-Tissue Expression (GTEx) pilot analysis: Multitissue gene regulation in humans,” Science, vol. 348, no. 6235, pp. 648–660, 2015.
-
[18] E. Y. Chen et al., “Enrichr: interactive and collaborative HTML5 gene list enrichment analysis tool,” BMC Bioinformatics, vol. 14, p. 128, Apr. 2013.
-
[19] OpenAI et al., “GPT-4 Technical Report,” arXiv [cs.CL], Mar. 15, 2023. [Online]. Available: http://arxiv.org/abs/2303.08774
-
[20] Gene Ontology Consortium, “Gene Ontology Consortium: going forward,” Nucleic Acids Res., vol. 43, no. Database issue, pp. D1049–56, Jan. 2015.
-
[21] M. Kutmon et al., “WikiPathways: capturing the full diversity of pathway knowledge,” Nucleic Acids Res., vol. 44, no. D1, pp. D488–94, Jan. 2016.
-
[22] J. A. Blake, C. J. Bult, J. T. Eppig, J. A. Kadin, J. E. Richardson, and Mouse Genome Database Group, “The Mouse Genome Database genotypes::phenotypes,” Nucleic Acids Res., vol. 37, no. Database issue, pp. D712–9, Jan. 2009.
-
[23] E. Sollis et al., “The NHGRI-EBI GWAS Catalog: knowledgebase and deposition resource,” Nucleic Acids Res., vol. 51, no. D1, pp. D977–D985, Jan. 2023.
-
[24] J. M. Memme, A. T. Erlich, G. Phukan, and D. A. Hood, “Exercise and mitochondrial health,” J. Physiol., vol. 599, no. 3, pp. 803–817, Feb. 2021.
-
[25] Y. Qiu et al., “Exercise sustains the hallmarks of health,” J Sport Health Sci, vol. 12, no. 1, pp. 8–35, Jan. 2023.
-
[26] R. P. Tracy and E. G. Bovill, “Thrombosis and cardiovascular risk in the elderly,” Arch. Pathol. Lab. Med., vol. 116, no. 12, pp. 1307–1312, Dec. 1992.
-
[27] M. S. El-Sayed, C. Sale, P. G. Jones, and M. Chester, “Blood hemostasis in exercise and training,” Med. Sci. Sports Exerc., vol. 32, no. 5, pp. 918–925, May 2000.
-
[28] A. A. Johnson and A. Stolzing, “The role of lipid metabolism in aging, lifespan regulation, and age-related disease,” Aging Cell, vol. 18, no. 6, p. e13048, Dec. 2019.
-
[29] Prospective Studies Collaboration et al., “Blood cholesterol and vascular mortality by age, sex, and blood pressure: a meta-analysis of individual data from 61 prospective studies with 55,000 vascular deaths,” Lancet, vol. 370, no. 9602, pp. 1829–1839, Dec. 2007.
-
[30] J. F. Horowitz and S. Klein, “Lipid metabolism during endurance exercise,” Am. J. Clin. Nutr., vol. 72, no. 2 Suppl, p. 558S–63S, Aug. 2000.
-
[31] P. V. Carapeto and C. Aguayo-Mazzucato, “Effects of exercise on cellular and tissue aging,” Aging , vol. 13, no. 10, pp. 14522–14543, May 2021.
